In Session metrics page, users are able to view the bandwidth metrics for a desired channel, whatever the content played: live stream, playlist, external stream Eclipse color theme.
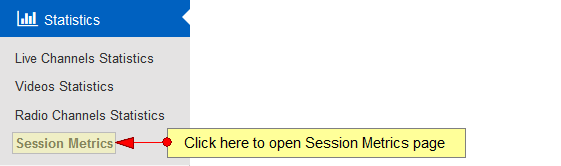
Click on Session metrics page, under Statistics menu:
Once the page opens, you can select the desired channel and filter a time period, to view the session metrics report:
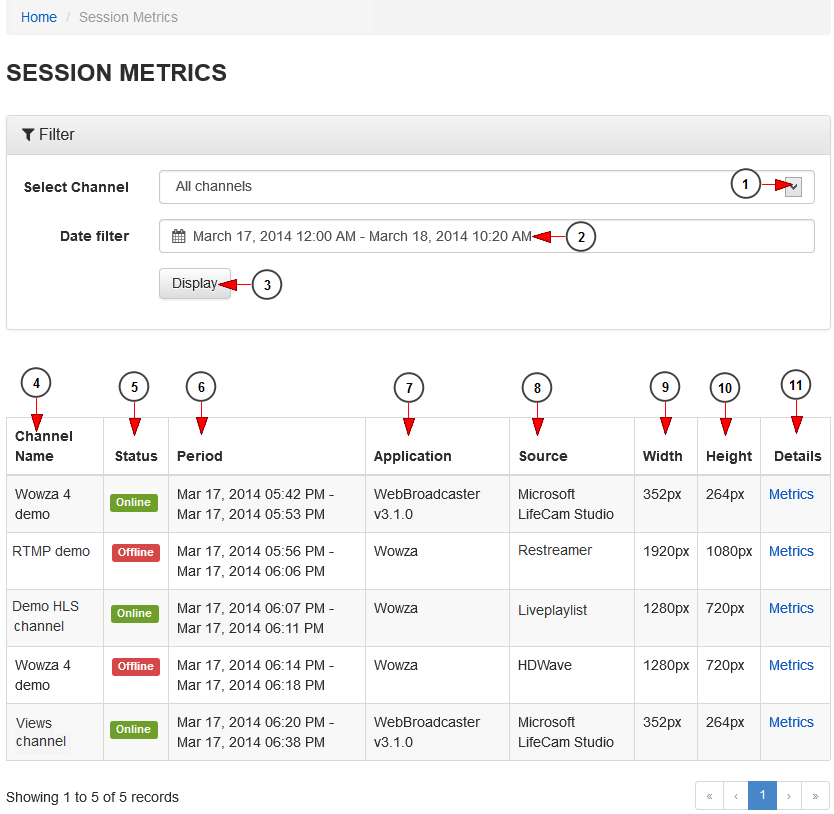
1 Encode download. Click here and select one of your existing live channels.
2. Click here to select a period of time. A calendar will open and you can filter the date range for the graphic display 디버그뷰 다운로드.
3. Click here to display the report for the selected criteria.
4. Here you can see the name of the channel where the broadcast session took place 불량도 다운로드.
5. Here you can see the current status of the channel.
6. Here you can see the time period of the broadcast session ciboard 프리미엄 다운로드.
7. Here you can see the application used for broadcasting.
8. Here you can see the name of the content source: live playlist, external stream or live stream youtube video files.
9. Here you can see the width for encoding the live stream.
10. Here you can see the height for encoding the live stream what you want to eat your pancreas.
11. Click here to view the metrics graphic of the streaming session.
Time filter calendar
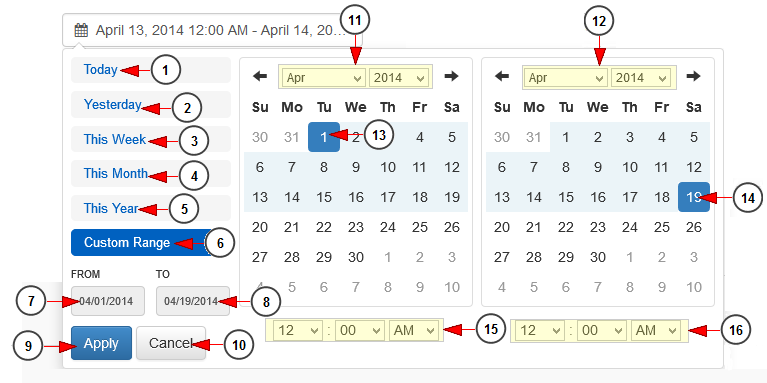
1 수박씨닷컴 다운로드. Click here to select the current day to view the bandwidth usage graph.
2. Click here to select the previous day to view the bandwidth usage graph skyrim hangul patch.
3. Click here to select the current week to view the bandwidth usage graph.
4. Click here to select the current month to view the bandwidth usage graph Food men and women download.
5. Click here to select the current year to view the bandwidth usage graph.
6. Click here to select a custom range to view the bandwidth usage graph. The 2 calendars will be displayed like in the picture above.
7. Click here to select a start date for the date range filter.
8. Click here to select an end date for the date range filter.
9. Click here to apply the selected dates.
10. Click here to cancel selecting a custom range period.
11. Select from the drop-down menus the desired month and year for the start date.
12. Select from the drop-down menus the desired month and year for the end date.
13. Click on the desired day of the calendar to select the start date.
14. Click on the desired day of the calendar to select the end date.
15. Select from the drop-down menus the exact hour and time for the start date.
16. Select from the drop-down menus the exact hour and time for the end date.
Channel metrics graphic
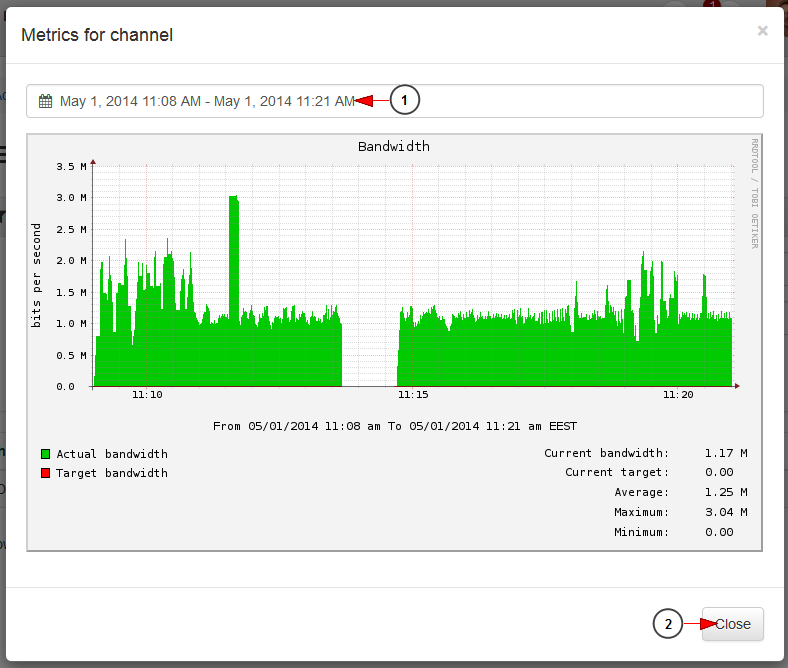
1. Click here to select a different time period.
2. Click here to close the overlay window.